Graphical User Interface
The user interface is divided into two windows: the “Control Window” and the “Response Box”. The “Control Window” is used to set the experimental parameters, while the “Response Box” is the interface with which listeners interact.
Quickstart
When pychoacoustics is launched, the “Control Window” displays the
default parameters for the “Audiogram” experiment. You can select
another experiment using the “Experiment” drop-down menu, and edit any
of the parameter fields you want to modify. Once you’re satisfied with
the parameters, you can store them by pressing the “Store” button. This
stores one experimental block with the chosen parameters. At this point
you can either start running the experiment by pressing the “Start”
button on the “Response Box”, or you can add more experimental blocks by
clicking on the “New Block” button.
To save the parameters to a file click on the “Save Prm” button. Parameter files that have been saved in this way can be later loaded into the program by using the “Load Prm” button.
To save the results of your experiment to a file, click on the “Save
Results” button. If you have forgotten to specify a results file in this
way, pychoacoustics will save the results in a file called
test.txt in the working directory.
The Control Window
The control window contains a set of widgets to manage the setup of the experiments, running the experiments, processing results files and managing application preferences. Some of the widgets are general, and some of them are specific either to a given paradigm (e.g. adaptive vs constant stimuli paradigm) or to a given experiment.
In the next section the function of these widgets will be explained, starting with the widgets that are general to all experiments and paradigms.
General Widgets (left panel)
Listener This is simply a label that you can use to identify the listener who is being tested. This label will be written in the header of the results file.
Experiment Label. This is a label to identify the experiment you are running. This label will be written in the header of the results file.
Session This is a label to identify the experimental session, it can be a number or a string. This label will be written in the header of the results file.
Condition Label This is a label to identify the experimental condition of the current block of trials. It is optional, but it may be useful when sorting the experimental results (see Tabular Results Files).
Task Label This label will be shown in the response box to tell the listener which task s/he’s doing. Useful in case different tasks are mixed within a session.
Instructions This box allows to give task instructions to the listener. If the block of trials occurs at a block position in which task instructions are set to be shown (see “Show Instructions At BP” field below), the text written in this box will will be shown to listeners at the beginning of the block of trials (see Displaying Task Instructions for more info).
Show Instructions At BP Indicate the block positions (see Block Presentation Position for a definition of block positions) at which the instructions should be shown to the listener. The block positions have to be indicated by a list of numbers separated by commas (see Displaying Task Instructions for more info).
End Command Here you can write an operating system command (e.g. a bash command on Unix systems or a DOS command on Windows systems) to be performed at the end of the experimental session. This could be used to run a custom script to analyse the result files, make a backup of the results files or other purposes. There are some variables (such as the name of the results file) that can be accessed with a special string. These are listed in Section OS Commands Table pychoacoustics variables Please refer to that section for further info on how to use them.
Shuffling Scheme By default when you click the “Shuffle” button,
pychoacousticsrandomly shuffles all blocks, here you can specify different shuffling schemes (e.g. shuffle the first four blocks among themselves and the last four blocks among themselves). Please refer to Section Block Presentation Position for more details.Proc. Res. Process the “block summary” file at the end of the experimental session in order to obtain a “session summary” file (see Result Files).
Proc. Res. Table Process the “table block summary” file at the end of the experimental session in order to obtain a “table session summary” file (see Result Files).
Plot Plot the results at the end of the experimental session. This function is available only if both matplotlib and pandas are installed. Plots are available only for some experimental paradigms.
PDF Plot Create a PDF file plotting the results at the end of the experimental session. This function is available only if both matplotlib and pandas are installed. Plots are available only for some experimental paradigms.
Experimenter Here you can select one of the experimenters listed in the experimenter database. Please refer to Section Edit Experimenters Dialog for further info on the experimenter database and how it can be used.
Experiment Selects the experiment for the current block.
Paradigm Selects the paradigm (e.g. transformed up-down, constant, etc…) for the current block. The list of paradigms available depends on the experiment that is selected.
Phones Choose from one of the phone models stored in the phones database. Please, refer to Section Edit Phones Dialog for further info on how to enter phones and calibration values in the database.
Sample Rate (Hz) Set the sampling rate of the sounds to be played. Any value can be entered in the text fields. However, you should enter a value that is supported by your soundcard. A value that is not supported by your souncard may lead to issues, although it’s more likely that your computer will perform an automatic sample rate conversion to a supported sample rate.
Bits Set the bit depth that
pychoacousticsuses to store sounds to a wav file or play them. Currently values of 16 and 32 bits are supported. A value of 32 bits can be used for 24-bit soundcards. Notice that achieving 24-bit output requires both a 24-bit souncard and a play command that can output 24-bit sounds. Therefore selecting a value of 32 bits here does not guarantee 24-bit playback even if you have a 24-bit souncard. Please, refere to Section Sound Output for further information on this issue.No. Repetitions Set the number of times the sequence of blocks stored in memory should be repeated. If the “Shuffle Mode” (see below) is set to “auto”, each time a new repetition starts the block positions will be shuffled. If the “Shuffle Mode” is set to “Ask”, each time a new repetition starts the user will be asked if s/he wants to shuffle the block positions. The “Reset” button resets the number of repetitions completed by the listener to zero.
Pre-Trial Silence (ms) Set a silent time interval before the start of each trial. Useful to avoid that a new trial starts immediately after the listener has given his/her response.
Warning Interval Choose whether to present a warning light at the beginning of each trial.
Warning Interval Duration (ms) Sets the duration of the warning interval light. This widget is shown only if the warning interval chooser is set to “Yes”.
Warning Interval ISI (ms) Sets the duration of the silent interval between the end of warning interval and the start of the first observation interval. This widget is shown only if the warning interval chooser is set to “Yes”.
Response Light Set the kind of feedback to give to participants at the end of each trial. “Feedback” will give feedback (e.g. flash a green, for a correct response, or red, for an incorrect response light. “Neutral” will acknowledge that a responses has been given, but will not give feedback as to whether the response was correct (e.g. flash a white light). “None” will not give any feedback or acknowledgment that a response has been given. (e.g. no light will be flashed, there will nonetheless be a silent interval equal to the response light duration, see below).
Response Light Type Determines the mode in which feedback or acknoledgment of listener responses is given. If “Light”, a colored light will be flashed (e.g. a green light to indicate a correct response, and a red light to indicate an incorrect response). If “Text”, a string will be presented (e.g. “Correct!” for a correct response, and “Incorrect!” for an incorrect response. If “Smiley”, a smiley will be painted in the response light box. Combinations of these three basic feedback presentation modes are also possible.
Response Light Duration (ms) Set the duration of the response light.
Results File Select a file for saving the results. Selecting an existing file will never overwrite its content, it will simply append the new results to its content. If no file is selected, the results will be saved in a file called
test.txtin the current working directory. You can select a file to save the results even after you have started a block of trials, the results get written to the file only at the end of the block.Shuffle Mode If the “Shuffle Mode” is “auto”, the block presentation positions will be automatically shuffled at the beginning of a series of blocks. If the “Shuffle Mode” is “Ask”, at the beginning of a series of blocks the user will be asked if the block presentation positions should be shuffled or not. If the “Shuffle Mode” is “No”, the block presentation positions will not be automatically shuffled at the beginning of a series of blocks. See Section Block Presentation Position for further information on shuffling the block presentation positions.
Response Mode When “Real Listener” is selected,
pychoacousticswaits for responses from a human listener. When “Automatic” is selected the program will give responses by itself with a certain percentage correct, that can be specified in the “Percent Correct (%)” text field. This mode is mostly useful for debugging purposes, however it can also be used for experiments in which the participants are passively listening to the stimuli (e.g. some neuroimaging experiments that record cerebral responses rather than behavioural responses). In “Simulated Listener” modepychoacousticswill give responses on the bases of an auditory model. This model needs to be specified in the experiment file, the “Simulated Listener” mode provides just a hook to redirect the control flow to your model. When the “Psychometric” listener mode is selected responses are given automatically according to the shape of a psychometric function (see boxes below for specifying the psychometric function shape). The “Psychometric” listener mode works only for adaptive paradigms (e.g. tranformed up-down, weighted up-down, PEST, UML, PSI). Please, refer to Section Response Mode for more information.Psychometric Listener Function The function family for the psychometric listener. Currently supported functions are “Logistic”, “Gaussian” (normal), “Gumbel”, and “Weibull”.
Psychometric Listener Function Fit Whether the psychometric function is fitted on “Linear” or “Logarithmic” coordinates. With the transformed up-down, PEST, and weighted up-down paradigms you should choose “Logarithmic” if you’re using a geometric adaptive procedure. With the PSI and UML paradigms you should choose “Logarithmic” if your the stimulus scaling is set to “Logarithmic”.
Psychometric Listener Midpoint The midpoint of the psychometric function, that is the middle point between chance performance and maximum performance. For a two-alternative forced choice task this will correspond to the point at which the listener achieves a 75% correct performance.
Psychometric Listener Slope The slope of the psychometric function. Please note that slopes measured with different psychometric function families (e.g. “Logistic” and “Gaussian”) are not directly comparable.
Psychometric Listener Lapse The lapse rate of the psychometric listener.
Save psychometric listener data Save the psychometric listener data to a text file. The first column of the saved file corresponds to the probability of a correct response. The second column corresponds to the stimulus value at which the psychometric listener achieves that probability of a correct response.
Plot psychometric listener function Plot the psychometric function defined for the psychometric listener.
Additional Widgets (left panel)
The following widgets are present only in some experiments:
ISI (ms) Inter-stimulus silent interval, in ms.
Intervals Set the number of observation intervals.
Alternatives Set the number of response alternatives.
Alternated (AB) Reps. This setting makes it possible to present stimuli with the ABAB AAAA paradigm (see [KingEtAl2013] ). If the value is set to zero, then on each interval only one stimulus will be presented, either the standard (A), or the comparison (B) stimulus. If the value is set to one, then the correct interval will contain the an alternation of the standard and comparison stimuli (AB), while the incorrect interval will contain two standards (AA). If the value is set to two, then the correct interval will contain two alternations of the standard and comparison stimuli (ABAB) while the incorrect interval will contain four repetitions of the standard and so on.
Alternated (AB) Reps. ISI (ms) Set silent interval between stimuli presented within each AAAA or ABAB interval.
Pre-Trial Interval Choose whether to present the pre-trial interval.
Pre-Trial Interval ISI (ms) Sets the duration of the silent interval between the end of pre-trial interval and the start of the next interval. This widget is shown only if the pre-trial interval chooser is set to “Yes”.
Precursor Interval Choose whether to present the precursor interval.
Precursor Interval ISI (ms) Sets the duration of the silent interval between the end of precursor interval and the start of the next interval. This widget is shown only if the precursor interval chooser is set to “Yes”.
Postcursor Interval Choose whether to present the postcursor interval.
Postcursor Interval ISI (ms) Sets the duration of the silent interval between the end of postcursor interval and the start of the next interval. This widget is shown only if the postcursor interval chooser is set to “Yes”.
General Widgets (right panel)
Load Prm Load in memory experimental parameters stored in a
.prmfile. See Section Parameters Files for more info.Save Prm Save experimental parameters stored in memory in a
.prmfile. See Section Parameters Files for more info.Delete Delete the current block from the list of blocks stored in memory.
Undo Unsaved Reset the parameters in the current block to the parameters that were last saved.
Store Store the parameters changes in memory.
Store ’n’ add Store the parameter changes in memory and add a new parameters block.
Store ’n’ go Store the parameter changes in memory and move to the next block storage point.
New Block Create a new parameters block (the parameters of the current block will be copied in the new one).
Previous Move to the previous block storage point.
Next Move to the next block storage point.
Shuffle Shuffle the block presentation positions (see Block Presentation Position).
Reset Reset the block presentation positions and move to the first block position (see Block Presentation Position).
Jump to Block Jump to a given block storage point.
Previous Position Move to the previous block presentation position (see Block Presentation Position).
Next Position Move to the next block presentation position (see Block Presentation Position).
Jump to Position Jump to the given block presentation position (see Block Presentation Position).
Shift Blk. Down Shift the current block to a lower storage point.
Shift Blk. Up Shift the current block to a higher storage point.
Experiment Doc Show the available documentation for the current experiment.
Paradigm Widgets
1-Pair Same/Different Paradigm Widgets
No. Trials Set the number of trials to be presented in the current block.
No. Practice Trials Set the number of practice trials to be presented in the current block. Practice trials are presented at the beginning of the block; the responses to these trials are not included in the statistics.
Constant 1-Interval 2-Alternatives Paradigm Widgets
No. Trials Set the number of trials to be presented in the current block.
No. Practice Trials Set the number of practice trials to be presented in the current block. Practice trials are presented at the beginning of the block; the responses to these trials are not included in the statistics.
Constant m-Intervals n-Alternatives Paradigm Widgets
No. Trials Set the number of trials to be presented in the current block.
No. Practice Trials Set the number of practice trials to be presented in the current block. Practice trials are presented at the beginning of the block; the responses to these trials are not included in the statistics.
Multiple Constants ABX Paradigm Widgets
No. Trials Set the number of trials to be presented in the current block.
No. Practice Trials Set the number of practice trials to be presented in the current block. Practice trials are presented at the beginning of the block; the responses to these trials are not included in the statistics.
No. Differences Set the number of comparisons to perform.
Multiple Constants 1-Interval 2-Alternatives Paradigm Widgets
No. Trials Set the number of trials to be presented in the current block for each condition.
No. Practice Trials Set the number of practice trials to be presented in the current block for each condition. The responses to these trials are not included in the statistics.
No. Differences Set the number of conditions to be used in the current block.
Multiple Constants m-Intervals n-Alternatives Paradigm Widgets
No. Trials Set the number of trials to be presented in the current block for each condition.
No. Practice Trials Set the number of practice trials to be presented in the current block for each condition. The responses to these trials are not included in the statistics.
No. Differences Set the number of conditions to be used in the current block.
Odd One Out Paradigm Widgets
No. Trials Set the number of trials to be presented in the current block.
No. Practice Trials Set the number of practice trials to be presented in the current block. Practice trials are presented at the beginning of the block; the responses to these trials are not included in the statistics.
No. Differences Set the number of comparisons to perform.
PEST Paradigm Widgets
WARNING PEST support is experimental and has received very little testing!
Procedure If “Arithmetic” the quantity defined by the step size will be added or subtracted to the parameter that is adaptively changing. If “Geometric” the parameter that is adaptively changing will be multiplied or divided by the quantity defined by the step size.
Corr. Resp. Move Track This determines whether correct responses move the adaptive track down, or up. Choose down if you want the adaptive parameter to decrease as a consequence of correct responses. Choose up if you want the adaptive parameter to increase as a consequence of correct responses. For example, in a signal detection task in which the signal level is varied you should choose
Down(signal level decreases as a consequence of correct responses). On the other hand, in a signal detection task in which the noise level is varied you should chooseUp(noise level increases as a consequence of correct responses).Percent Correct Tracked Set the percentage correct point on the psychometric function to be tracked by the adaptive procedure.
Initial Step Size Set the initial step size.
Minimum Step Size Set the minimum step size. When the minimum step size is reached the block is terminated.
Maximum Step Size Set the maximum allowed step size.
W Deviation limit of the sequential test (see [TaylorAndCreelman1967]).
PSI Paradigm Widgets
Transformed Up-Down Paradigm Widgets
Procedure If
Arithmeticthe step size will be added or subtracted to the parameter that is adaptively varied. IfGeometricthe parameter that is adaptively varied will be multiplied or divided by the step size.Corr. Resp. Move Track This determines whether correct responses move the adaptive track down, or up. Choose down if you want the adaptive parameter to decrease as a consequence of correct responses. Choose up if you want the adaptive parameter to increase as a consequence of correct responses. For example, in a signal detection task in which the signal level is varied you should choose
Down(signal level decreases as a consequence of correct responses). On the other hand, in a signal detection task in which the noise level is varied you should chooseUp(noise level increases as a consequence of correct responses).Rule Down Set the number of consecutive correct, or incorrect responses, depending on which type of responses move the track down, needed to make a step down.
Rule Up Set the number of consecutive correct, or incorrect responses, depending on which type of responses move the track up, needed to make a step up.
Initial Turnpoints Set the number of initial turnpoints. The initial turnpoints serve to bring quickly the adaptive track towards the listener’s threshold. These turnpoints are not included in the threshold estimate.
Total Turnpoints Set the number of total turnpoints. The number of total turnpoints is equal to the number of initial turnpoints that are not included in the threshold estimate plus the number of turnpoints that you want to use for the threshold estimate.
Step Size 1 Set the step size for the initial turnpoints.
Step Size 2 Set the step size to be used after the number of initial turnpoints has been reached.
Transformed Up-Down Interleaved Paradigm Widgets
Procedure If “Arithmetic” the quantity defined by the step size will be added or subtracted to the parameter that is adaptively changing. If “Geometric” the parameter that is adaptively changing will be multiplied or divided by the quantity defined by the step size.
No. Tracks Set the number of adaptive tracks.
Max. Consecutive Trials x Track Set the maximum number of consecutive trials per track.
Turnpoints to Average Since track selection is pseudo-random, it may happen that for a track the number of total turnpoints collected is greater than the number of total turnpoints requested for that track. If “All final step size (even)” is selected, the threshold will be estimated using all the turnpoints collected after the initial turnpoints, unless the number of these turnpoints is odd, in which case the first of these turnpoints will be discarded. If “First N final step size” is selected the threshold will be estimated using only the number of requested turnpoints collected after the initial turnpoints. If “Last N final step size” is selected the threshold will be estimated using only the last \(N\) turnpoints, where \(N\) equals the number of requested turnpoints.
Corr. Resp. Move Track X This determines whether correct responses move the adaptive track down, or up. Choose
Downif you want the adaptive parameter to decrease as a consequence of correct responses. ChooseUpif you want the adaptive parameter to increase as a consequence of correct responses. For example, in a signal detection task in which the signal level is varied you should chooseDown(signal level decreases as a consequence of correct responses). On the other hand, in a signal detection task in which the noise level is varied you should chooseUp(noise level increases as a consequence of correct responses).Rule Down Track X Set the number of consecutive correct responses needed to subtract the current step size from the adaptive parameter (for arithmetic procedures) or divide the adaptive parameter by the current step size (for geometric procedures) for track number \(X\).
Rule Up Track X Set the number of consecutive correct, or incorrect responses, depending on which type of responses move track X down, needed to make a step down for track X.
Initial Turnpoints Track X Set the number of consecutive correct, or incorrect responses, depending on which type of responses move track X up, needed to make a step up for track X.
Total Turnpoints Track X Set the number of total turnpoints for track number \(X\). The number of total turnpoints is equal to the number of initial turnpoints that are not included in the threshold estimate plus the number of turnpoints that you want to use for the threshold estimate.
Step Size 1 Track X Set the step size for the initial turnpoints for track number \(X\).
Step Size 2 Track X Set the step size to be used after the number of initial turnpoints has been reached for track number \(X\).
UML Paradigm Widgets
Psychometric Function The shape of the psychometric function used to fit the responses of the listener.
Posterior Summary Choose whether to use the mean or the mode for the estimation
of parameter values from the Bayesian posterior distribution of parameter values.
Plot UML Par. Space Generate a graphical summary of the parameter space used to
initialize the UML procedure.
No. Trials Set the number of trials to be presented in the current block.
Swpt. Rule Choose whether to use an up-down or a random sweetpoint selection rule.
Rule Down The number of consecutive correct responses necessary to move to the lower sweetpoint.
Stim. Min Set the minimum value of the stimulus dimension that is being varied adaptively (e.g. signal level, or frequency difference).
Stim. Max Set the maximum value of the stimulus dimension that is being varied adaptively (e.g. signal level, or frequency difference).
Stim. Scaling Indicate whether the stimulus dimension that is being varied adaptively should be scaled linearly or logarithmically. The
Suggested Lapse Swpt. The suggested stimulus value for the lapse rate sweetpoint. This value is used as the lapse rate sweetpoint unless the current estimate of the psychometric function at the probability value
Pr. Corr. at Est. Lapse Swpt(see below) is larger. In the latter case the current estimate of the psychometric function at the probability valuePr. Corr. at Est. Lapse Swptis used as the lapse rate sweetpoint, as long as it is smaller thanStim. Max, in which caseStim. Maxwill be used as the lapse rate sweet point.Pr. Corr. at Est. Lapse Swpt. The proportion correct at the estimated lapse sweet point. If the estimated lapse sweetpoint exceeds the will be used the suggested lapse sweetpoint, the estimated lapse sweetpoint will be used as the lapse rate sweetpoint.
Mid Point Min The minimum possible value of the midpoint of the psychometric function.
Mid Point Max The maximum possible value of the midpoint of the psychometric function.
Mid Point Step The size of the step between successive points in the grid defining the parameter space for the midpoint of the psychometric function.
Mid Point Prior The shape of the prior distribution for the midpoint of the psychometric function.
Mid Point mu The mean of the prior distribution for the midpoint of the psychometric function.
Mid Point STD The standard deviation of the prior distribution for the midpoint of the psychometric function.
Slope Min The minimum possible value of the slope of the psychometric function.
Slope Max The maximum possible value of the slope of the psychometric function.
Slope Step The size of the step between successive points in the grid defining the parameter space for the slope of the psychometric function.
Slope Spacing Indicate whether the spacing between successive points in the grid defining the parameter space for the slope of the psychometric function should be linear or logarithmic.
Slope Prior The shape of the prior distribution for the slope of the psychometric function.
Slope mu The mean of the prior distribution for the slope of the psychometric function.
Slope STD The standard deviation of the prior distribution for the slope of the psychometric function.
Lapse Min The minimum possible value of the lapse rate of the psychometric function.
Lapse Max The maximum possible value of the lapse rate of the psychometric function.
Lapse Step The size of the step between successive points in the grid defining the parameter space for the lapse rate of the psychometric function.
Lapse Spacing Indicate whether the spacing between successive points in the grid defining the parameter space for the lapse rate of the psychometric function should be linear or logarithmic.
Lapse Prior The shape of the prior distribution for the lapse rate of the psychometric function.
Lapse mu The mean of the prior distribution for the lapse rate of the psychometric function.
Lapse STD The standard deviation of the prior distribution for the lapse rate of the psychometric function.
Load UML state from prev. blocks If
Yes, at the end of each block the state of the UML posterior parameter distribution will be saved in a file named after the condition label of the block. When a subsequent block with the same condition label is encountered this file will be used to set the initial UML posterior parameter distribution for the block instead of the priors specified in the control window.
Weighted Up-Down Paradigm Widgets
Procedure If “Arithmetic” the quantity defined by the step size will be added or subtracted to the parameter that is adaptively changing. If “Geometric” the parameter that is adaptively changing will be multiplied or divided by the quantity defined by the step size.
Corr. Resp. Move Track This determines whether correct responses move the adaptive track down, or up. Choose down if you want the adaptive parameter to decrease as a consequence of correct responses. Choose up if you want the adaptive parameter to increase as a consequence of correct responses. For example, in a signal detection task in which the signal level is varied you should choose
Down(signal level decreases as a consequence of correct responses). On the other hand, in a signal detection task in which the noise level is varied you should chooseUp(noise level increases as a consequence of correct responses).Percent Correct Tracked Set the percentage correct point on the psychometric function to be tracked by the adaptive procedure. The ratio of the “Up” and “Down” steps is automatically adjusted by the software to satisfy this criterion.
Initial Turnpoints Set the number of initial turnpoints. The initial turnpoints serve to bring quickly the adaptive track towards the listener’s threshold. These turnpoints are not included in the threshold estimate.
Total Turnpoints Set the number of total turnpoints. The number of total turnpoints is equal to the number of initial turnpoints that are not included in the threshold estimate plus the number of turnpoints that you want to use for the threshold estimate.
Step Size 1 Set the “Down” step size for the initial turnpoints. The “Up” step size is automatically calculated to satisfy the “Percent Correct Tracked” criterion.
Step Size 2 Set the “Down” step size to be used after the number of initial turnpoints has been reached. The “Up” step size is automatically calculated to satisfy the “Percent Correct Tracked” criterion.
Weighted Up-Down Interleaved Paradigm Widgets
Procedure If “Arithmetic” the quantity defined by the step size will be added or subtracted to the parameter that is adaptively changing. If “Geometric” the parameter that is adaptively changing will be multiplied or divided by the quantity defined by the step size.
No. Tracks Set the number of adaptive tracks.
Max. Consecutive Trials x Track Set the maximum number of consecutive trials per track.
Turnpoints to Average Since track selection is pseudo-random, it may happen that for a track the number of total turnpoints collected is greater than the number of total turnpoints requested for that track. If “All final step size (even)” is selected, the threshold will be estimated using all the turnpoints collected after the initial turnpoints, unless the number of these turnpoints is odd, in which case the first of these turnpoints will be discarded. If “First N final step size” is selected the threshold will be estimated using only the number of requested turnpoints collected after the initial turnpoints. If “Last N final step size” is selected the threshold will be estimated using only the last \(N\) turnpoints, where \(N\) equals the number of requested turnpoints.
Corr. Resp. Move Track X This determines whether correct responses move the adaptive track number X down, or up. Choose
Downif you want the adaptive parameter to decrease as a consequence of correct responses. ChooseUpif you want the adaptive parameter to increase as a consequence of correct responses. For example, in a signal detection task in which the signal level is varied you should chooseDown(signal level decreases as a consequence of correct responses). On the other hand, in a signal detection task in which the noise level is varied you should chooseUp(noise level increases as a consequence of correct responses).Percent Correct Tracked Set the percentage correct point on the psychometric function to be tracked by the adaptive procedure for track number \(X\). The ratio of the “Up” and “Down” steps is automatically adjusted by the software to satisfy this criterion.
Initial Turnpoints Track X Set the number of initial turnpoints for track number \(X\). The initial turnpoints serve to bring quickly the adaptive track towards the listener’s threshold. These turnpoints are not included in the threshold estimate.
Total Turnpoints Track X Set the number of total turnpoints for track number \(X\). The number of total turnpoints is equal to the number of initial turnpoints that are not included in the threshold estimate plus the number of turnpoints that you want to use for the threshold estimate.
Step Size 1 Track X Set the “Down” step size for the initial turnpoints for track number \(X\). The “Up” step size is automatically calculated to satisfy the “Percent Correct Tracked” criterion.
Step Size 2 Track X Set the “Down” step size to be used after the number of initial turnpoints has been reached for track number \(X\). The “Up” step size is automatically calculated to satisfy the “Percent Correct Tracked” criterion.
The Menu Bar
A screenshot of the menu bar is shown in Figure The menu bar. This bar is located in the upper left corner of the “Control Window”. Each menu will be described below.
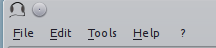
The menu bar
Process Results Dialog
Figure The process results dialog show a screenshot of the process results dialog. The dialog is the same for all procedures, except that for procedures in which d’ is computed, there is an additional checkbox asking whether to apply a correction to hit/false alarm rates of zero or one. For information on the format of the result files, please see Section Result Files. For tabular results files, if both matplotlib and pandas are installed there are additional checkboxes allowing to plot the results in a window or on a pdf file. Not all experimental paradigms support plotting.
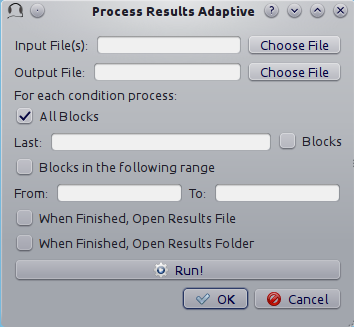
The process results dialog
Input File(s) Give the filepath of one or more files to be processed. The “Choose File” button can be used to select the file(s). Multiple filepaths should be separated by a semicolon “
;”.Output File Give the filename of the output file.
For each condition process:
All Blocks If checked, all blocks in the result file(s) will be processd.
Last X Blocks If checked, only the last \(X\) blocks will be processed.
Blocks in the following range If checked, only blocks in the specified range will be processed (indexing starts from 1).
d-prime correction If checked, convert hit rates of \(0\) and \(1\) to \(1/2N\) and \(1-1/(2N)\) respectively, where \(N\) is the number of trials, to avoid infinite values of d’ (see [MacmillanAndCreelman2005] p. 8). This checkbox is available only for some paradigms.
When finished, open results file If checked, the output file will be opened in the default text editor when processing has finished.
When finished, open results folder If checked, the folder containing the output file will be opened when processing has finished.
Run! Click this button to process the result files.
Edit Preferences Dialog
The preferences dialog is divided into several tabs. These are described in turn below.
General
Language (requires restart) Choose the application language. At the moment and for the foreseeable future only English is supported.
Country (requires restart) Set the country locale to be used for the application. Some things (for example the way dates are written in result files) depend on this setting.
Response Box Language (requires restart) Choose the language to be used for the “Response Box”. This sets the language to be used for the button labels and other GUI elements that the experimental listener is presented with.
Response Box Country (requires restart) Set the country locale for the response box.
csv separator Choose the separator field to be used when writing the csv tabular result files.
Warn if listener name missing If checked, pop up a warning message if the listener name is missing at the beginning of a session.
Warning if session label missing If checked, pop up a warning message if the session label is missing at the beginning of a session.
Process results when finished If checked, process automatically the block summary file to generate the session summary file at the end of the experiment.
d-prime correction If checked, when automatically processing result files, convert hit rates of \(0\) and \(1\) to \(1/2N\) and \(1-1/(2N)\) respectively, where \(N\) is the number of trials, to avoid infinite values of d’ (see [MacmillanAndCreelman2005] p. 8).
Max Recursion Depth (requires restart) Set the maximum recursion depth of the Python interpreter stack. This setting should be changed only if you intend to run
pychoacousticsin automatic or simulated listener response mode (see Response Mode). Beware, setting a max recursion depth value smaller than the default value may causepychoacousticsto crash or not even start. In casepychoacousticsdoes not start because of this, delete your preferences settings file to restore the default max recursion depth value.Execute command at startup Executes an OS command at startup. May be useful to initialize a soundcard in certain situations.
Sound
Play Command Set an internal or external command to play sounds.
Device Set the soundcard to be used to play sounds. This chooser is available only for certain internal play commands (currently alsaaudio and pyaudio).
Buffer Size (samples) Set the buffer size in number of samples to be used to output sounds. This chooser is available only for certain internal play commands (currently alsaaudio and pyaudio).
Default Sampling Rate Set the default sampling rate.
Default Bits Set the default bit depth.
Wav manager (requires restart) Choose the wav manager.
Write wav file Write wav files with the sounds played on each trial in the current
pychoacousticsworking directory.Write sound sequence segment wavs For sound sequences, write a wav file for each segment of the sequence in the current
pychoacousticsworking directory.Append silence to each sound (ms) Append a silence of the given duration at the end of each sound. This is useful on some versions of the Windows operating system that may cut the sound buffer before it has ended resulting in audible clicks.
Response Box
Response Box Button Font Choose the font for the response box button.
Correct Light Color Choose the color of the feedback light after a correct response.
Incorrect Light Color Choose the color of the feedback light after an incorrect response.
Neutral Light Color Choose the color of the feedback light when specific feedback as to the correctness of the response is not given. A light is instead simply flashed to acknowledge that the response has been recorded.
Off Light Color Choose the color of the response light when the response light is off (that is when feedback of any kind is not being given.
Response Light Font Choose the font of used to present text in the response light area when feedback is textual.
Correct Response Text Feedback Choose the feedback text to show in case of a correct response. If left to
(Default), a default message will be shown in the language chosen for the response box (if available). Applies only if feedback is textual.Incorrect Response Text Feedback Choose the feedback text to show in case of an incorrect response. If left to
(Default), a default message will be shown in the language chosen for response box (if available). Applies only if feedback is textual.Neutral Response Text Feedback Choose the feedback text to show when specific feedback as to the correctness of the response is not given. If left to
(Default), a default message will be shown in the language chosen for response box (if available). Applies only if feedback is textual.Correct Text Color Choose the color of the feedback text to show in case of a correct response. Applies only if feedback is textual.
Incorrect Response Text Feedback Choose the color of the feedback text to show in case of an incorrect response. Applies only if feedback is textual.
Neutral Response Text Feedback Choose the color of the feedback text to show when specific feedback as to the correctness of the response is not given. Applies only if feedback is textual.
Notifications
Play End Message If checked, play a wav file at the end of the experiment. This could be short message to let the listeners know they have finished and thank them for their participation in the experiment. One or more wav files need to be set through the “Choose wav” button for this work.
Choose wav Choose the wav file to be played as the end message. Clicking on this button brings up another dialog where you can select the wav files to be played and their output RMS. Only one of the wav files listed here and with the “Use” flag set to will be randomly chosen and played.
blocks before end of experiment Set how many blocks before the end of the experiment the two actions listed below (send notification e-mail and execute custom command) should be performed.
Send notification e-mail If checked, send a notification e-mail to the experimenter to notify her that the experiment is about to finish.
Execute custom command If checked, execute an operating system command before the end of the experiment. This command could be used to automatically send an sms for example.
Send data via e-mail At the end of the experiment, send the results file to the experimenter .
Execute custom command At the end of the experiment, execute an operating system command.
Outgoing Server (SMTP) Set the name of the SMTP server to be used by
pychoacousticsto send e-mails.Port Set the port number for the SMTP server.
Security Set the security protocol for network exchanges with the SMTP server.
Server requires identification Check this if the SMTP server requires identification.
Username Set the username for the SMTP server.
Password Set the password for the SMTP server.
Send test e-mail Send a test e-mail to check that the server settings are OK.
EEG
ON Trigger The ON trigger value (decimal).
OFF Trigger The OFF trigger value (decimal).
Trigger Duration (ms) The duration of the trigger in milliseconds.
Edit Phones Dialog
A screenshot of the “Edit Phones” dialog is
shown in Figure Edit Phones Dialog.
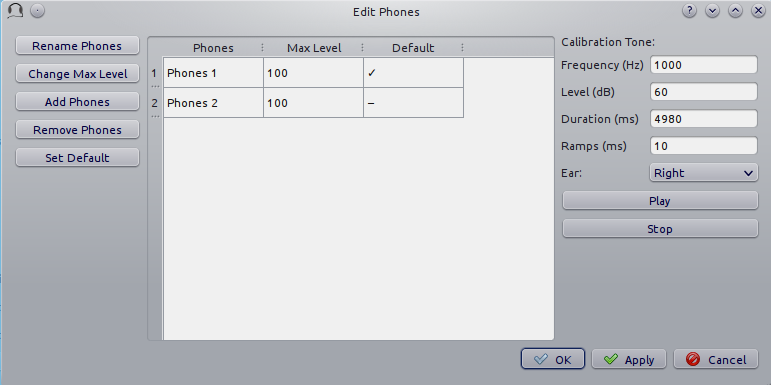
Edit Phones Dialog
Most of the fields should be pretty much self-explanatory. Using this
dialog you can add headphones/earphones models to the phones database.
The phone with the “Default” flag set will be selected by default
when pychoacoustics is started. In the “Max Level” field you should
enter the level in dB SPL that is output by the phone for a full
amplitude sinusoid (a sinusoid with a peak amplitude of 1).
This value will be used by pychoacoustics to output sounds at specific
levels in dB SPL. On the rightmost panel of
the dialog you have facilities to play a sinusoid with a specified
level. You can use these facilities to check with a SPL meter (or a
voltmeter depending on how you’re doing it) that the actual output level
corresponds to the desired output level. Using these facilities you can
also play a full amplitude sinusoid: you need to set the level of the
sinuoid to the “Max Level” of the phone in the dialog (whatever it is).
Be careful because it can be very loud! More detailed instructions on
the calibration procedure are provided below.
Calibrating with an SPL meter
Open the “Edit Phones” dialog. Select the phone for which you want to calibrate and note its
MaxLevel (by default this is set to 100 dB SPL). Use the rightmost panel to play
a 1-kHz sinusoid at the MaxLevel (e.g. 100 dB), and read the measurement on the SPL
meter. Change the MaxLevel for the phone to the measurement you just read on the SPL meter.
You don’t actually need to play the sinusoid at the MaxLevel (and it may be better not to do so
because you may get distortions at very high levels). Instead, you could for example
play it at a level equal to MaxLevel - 20. The reading that you would obtain from the SPL meter
would then be 20 dB below the MaxLevel. You would then simply add 20 to the SPL meter reading
and set MaxLevel to this value.
Calibrating with a voltmeter
Open the “Edit Phones” dialog. Select the phone for which you want to calibrate and note its
MaxLevel (by default this is set to 100 dB SPL). Use the rightmost panel to play
a 1-kHz sinusoid at the MaxLevel (e.g. 100 dB), and note the RMS voltage reading from
a voltmeter connected to a cable receiving input from the soundcard.
Manufacturers of professional phones usually provide datasheets indicating
what is the dB SPL level output by the phone when it is driven by a 1-volt RMS
sinusoid at 1 kHz. You can use this figure to calculate what the dB SPL output is for the
1-kHz sinusoid. Suppose that the dB SPL output for a 1-volt RMS sinusoid at 1 kHz
is \(L_r\), and the voltage output for the sinusoid played at MaxLevel is \(V_x\),
the dB SPL output for the sinusoid (\(L_x\)) will be:
if the reference RMS voltage in the datasheet is not 1 but some other value \(V_r\), \(L_x\) can be calculated as:
Finally, set the MaxLevel for the phone you’re calibrating to \(L_x\). As for the SPL meter calibration
you do not actually need to play the sinusoid at the MaxLevel (and it may be better not to do so
because you may get distortions at very high levels). Instead, you could for example
play it at a level equal to MaxLevel - 20. You would then add back the 20 dBs in the equation to
compute \(L_x\):
Edit Experimenters Dialog
A screenshot of the “Edit Experimenters” dialog is shown in Figure Edit Experimenters Dialog.
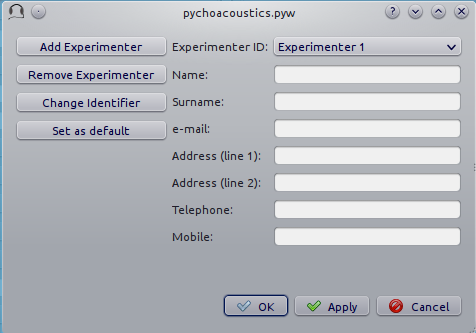
Edit Experimenters Dialog
Most of the fields should be pretty much self-explanatory. Here you can add the details of the experimenters that work in your lab in the experimenter database. The main functions of this database at the moment are a) writing the experimenter name in the results file; b) using the experimenter e-mail for sending notifications and/or results files (see Section sec-edit_pref_dia_notifications).
The Response Box
The “response box” consists of a large button (the “status button”) that is used to start a block of trials, a feedback light to display trial by trial feedback, interval lights to mark observation intervals, and response buttons. The responses can be given either by means of mouse clicks, or using the numeric keypad (key “1” for the first button, key “2” for the second button etc…). Responses given before all observation intervals have been presented are not accepted.
The status button can be activated by pressing the Ctrl+R shortcut.
At the start of each block the label of the “Status Button” is set to
“Start”. Once the listener starts a block of trials the label of the
status button changes to “Running”. When a whole series of blocks is
finished the label of the status button changes to “Finish”. If no
blocks are stored in memory the label of the status button is set to
“Wait”.
On the top left corner of the response box there is a semi-hidden menu
signalled by a little hyphen (“-”). If you click on it you have access
to two functions. The “Show/Hide Control Window” function can be used to
hide the control window while the experiment is running. This is useful
because it prevents the listener from accidentally changing your
experimental parameters or accidentally closing pychoacoustics (the
response box itself has no “close” button, so it is not possible to
close that). The “Show/Hide progress Bar” function can be used to
display a progress bar at the bottom of the response box. The progress
bar estimates what percentage of the experiment has been completed. This
estimate depends on the procedure used (for constant procedures it is
based on the number of trials done, while for adaptive procedures it is
based on the number of turnpoints reached) and on the specific
parameters of a given experiment (trial duration, number of trials, or
number or turnpoints, all of which can differ between blocks), so in
some cases the estimate can be off the mark. The “Show/Hide block
progress Bar” can be used to show the position of the current block and
the total number of blocks.